
New Tech Healthy Living
Smart Health Aide
Health in Hand
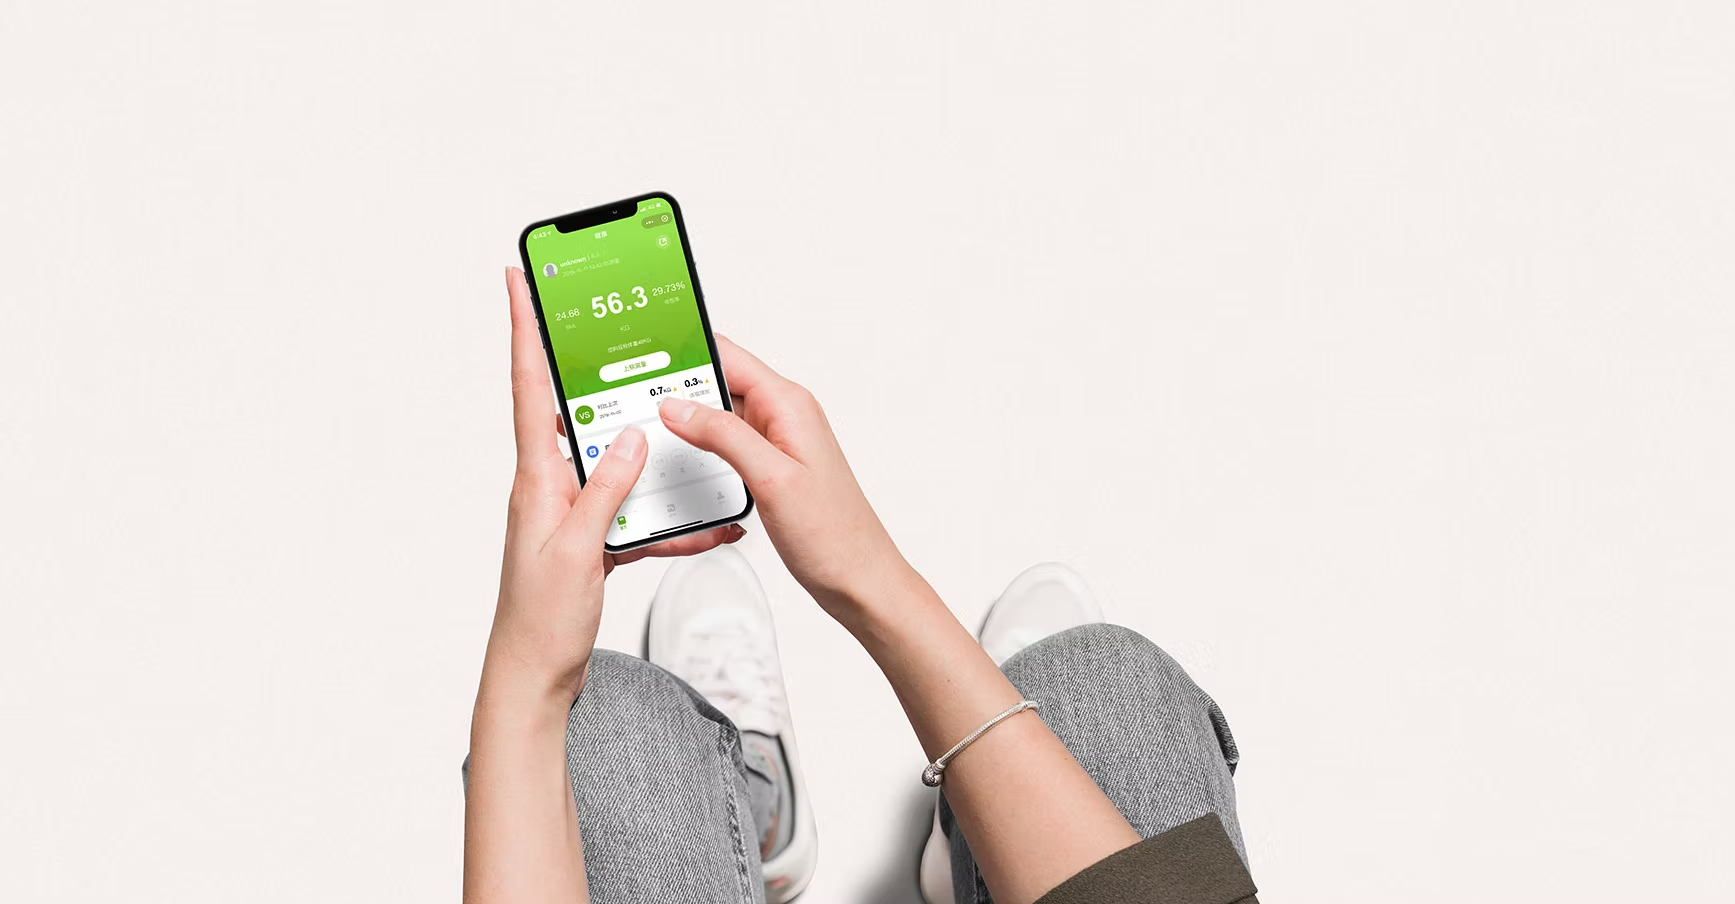
THE FUTURE FOOD® mini program: weekly reports and progress, anytime.
Smart Scale
Sub-optimal health is now common. Poor lifestyle and eating habits may raise the risk of chronic diseases such as high blood pressure, high blood sugar, high cholesterol and cardiovascular disease. When our routine is out of balance, we may feel tired, sleep poorly or have dry eyes. If discomfort persists, see a doctor early; don't ignore your body's signals.
6 Key Analyses
All in 25 Key Metrics
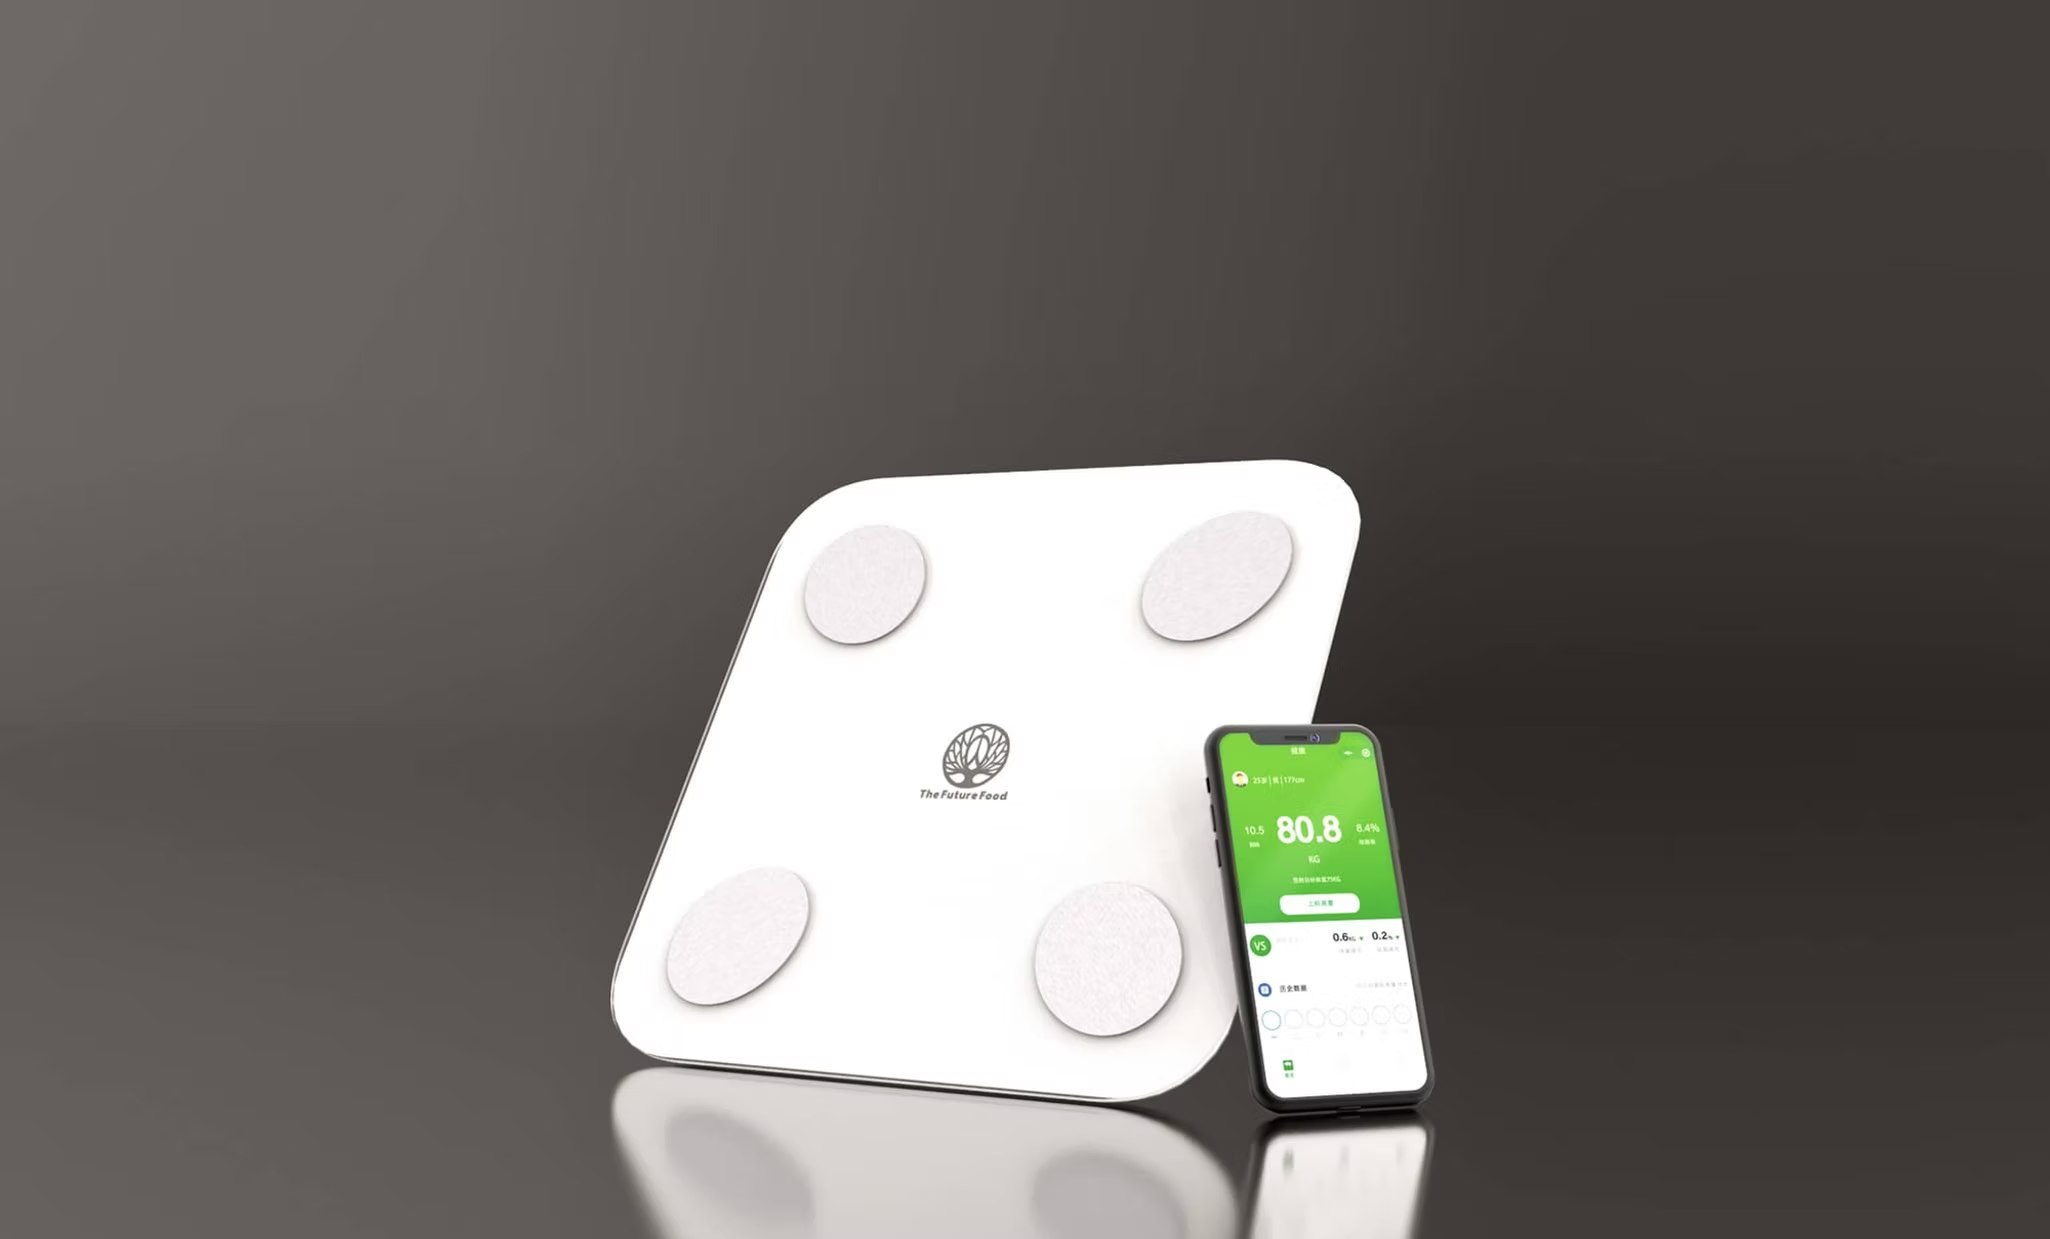
The smart scale adds a chip and electrodes to a regular scale. Besides weight, it measures 25 metrics such as fat, water, muscle, protein and bone, and assesses body type and health.
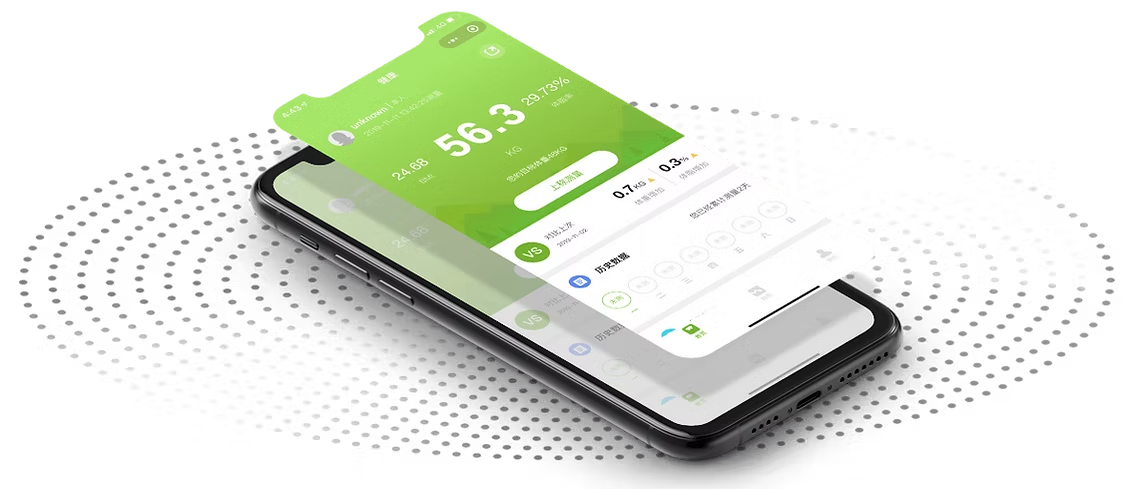
The Future Food® APP (a WeChat mini program) shows your history, measurements and assessments, so you can track weight and body composition day to day. Scale data is for reference only and cannot replace a doctor's diagnosis.
Decode your body in one tap
25 key metrics covering the body-composition indicators you need. Improvement starts with understanding.
BMI

Weight
Bone mass
BMR
Visceral fat level
Muscle %
Fat to lose
Weight to lose
Protein %
Ideal weight
Water %
Body type
Body age
Skeletal muscle
Subcutaneous fat
Muscle to gain
Muscle mass
Skeletal muscle %
Lean mass
Nutrition
Protein
Fat mass
Body water
Body fat %
Fat-burning HR
Measurements
Health check
Protein %
Body water
Body fat %
Body type
Bone mass
Obesity check
Subcutaneous fat
Visceral fat level
BMR
Muscle %
Body fat
Progress check
Visceral fat level
Fat-burning HR
Body age
Muscle %
Body fat
Assessments
Weight
Assesses body type and possible health risks against standards like body fat %.
Weight/BMI/Body fat %
Metabolism
Estimates BMR from height, age and body data, and assesses body-composition changes.
BMR / Body age / Protein %
Indicators
Analyses height, weight, body fat % and body age as a health reference.
Height/Weight/Fat %/Body age
10 key health indicators
-
The international measure of under- or overweight: BMI = weight (kg) ÷ height^2 (m)
-
BMI below 18.5: underweight may affect nutrition and bone health. Eat a balanced diet, exercise moderately, and see a doctor or dietitian if needed.
-
BMI 23+: may raise obesity-related chronic disease risk; mind your diet and exercise.
BMI
-
Excess visceral fat may raise the risk of several chronic diseases; worth watching.
-
Below level 9 is standard. Higher levels may raise the risk of type 2 diabetes, fatty liver and cardiovascular disease; adjust diet and lifestyle, and see a doctor.
Visceral fat level
-
Fat as a share of body weight. Normal adults: men 10%~20%, women 17%~30%; safe minimum: men 5%, women 13%~15%.
-
Too high: may raise the risk of chronic issues like heart disease and joint problems.
-
Too low: may affect energy and normal body functions; eat a balanced diet.
Body fat %
-
Typical BMR is 1100~1400 kcal for women and 1400~1700 kcal for men.
-
BMR depends on age, muscle mass and activity; values are for reference only.
-
Exercise more and eat a balanced diet to help maintain a healthy weight.
BMR
-
A reference age estimated from body-composition data, for reference only.
-
If it is higher than your actual age, start by adjusting your diet, exercise and routine.
Body age
-
Total muscle relative to weight, height and other data; a reference for your condition and muscle strength.
-
Asian standard: 31~34% for adult men, 25~27% for women.
-
Too low: may affect strength and mobility; older people fall more easily. Do some strength training and get enough protein.
-
On the high side: usually linked to exercise habits; for reference only.
Muscle %
-
Normal: 45%~65%; it also affects body fat % and muscle mass.
-
Too high or too low needs attention. Drink adequately and see a doctor if in doubt.
Water %
-
Asian standard: 16~20% of body weight.
-
Low: may reflect low protein intake or muscle mass. If too high, check that your diet is balanced.
-
Match protein intake to your needs; don't overdo it.
Protein %
-
An estimate of skeletal weight: generally 2~2.5kg for women and 2.5~3kg for men.
-
Low: get calcium, vitamin D and weight-bearing exercise; calcium helps build strong bones and teeth.
-
High: for reference only; see a doctor if in doubt.
Bone mass
-
Fat under the skin, above the deep fascia; it insulates and stores energy.
-
Asian standard abdominal skinfold: 5~15mm for men, 12~20mm for adult women.
-
Low: you may feel the cold more. High: may raise the risk of obesity-related diseases.
Subcutaneous fat

Quick to start, easy to use

Scan QR
Scan the QR code on the back of the box, or search for the "THE FUTURE FOOD" mini program in WeChat, then register a new account.
Bluetooth
Turn on Bluetooth and hold your phone close to the scale. It is paired when the app's home screen shows "Connected", or the scale shows the Bluetooth symbol after a light tap with your foot.
Weigh in
Once paired, step on barefoot. After the circle on the app's home screen spins for about 3 seconds, your body data is measured.
Just 3 simple steps to experience the powerful features of The Future Food® Smart Scale.

Keep an eye on your health
Regular health check-ups are an important way to know your body; scale data can serve as a daily reference.
The Future Food® Smart Scale records weight, body composition and other indicators, helping us understand how we change and build good habits.






Video guide: how to use THE FUTURE FOOD scale and mini program correctly.

1-to-1 Guidance
Any questions? Our consultants give attentive one-to-one guidance throughout.
Tailored to your needs
A science-based eating plan for each person.
Live online support
Questions about use? Ask a consultant.

Custom health plan
Well-planned, balanced eating,
tailored to your current status.